Marketing job vacancies more than triple since height of pandemic
There was a 302% rise in opportunities for marketers in the six months to August 2021 compared to the same period last year, according to data gathered for Marketing Week by job site Reed.
The market hit an all-time low in April last year, when there were just 2,125 jobs on offer. By June this year, however, the number of open roles had risen as high as 14,055, an increase of 561%.
The data shows marketing managers have been in particularly high demand, accounting for more than one in 10 roles over the past six months. Roles paying between £25,000 and £50,000 have been most in demand, accounting for 65% of available vacancies.
Source: Reed
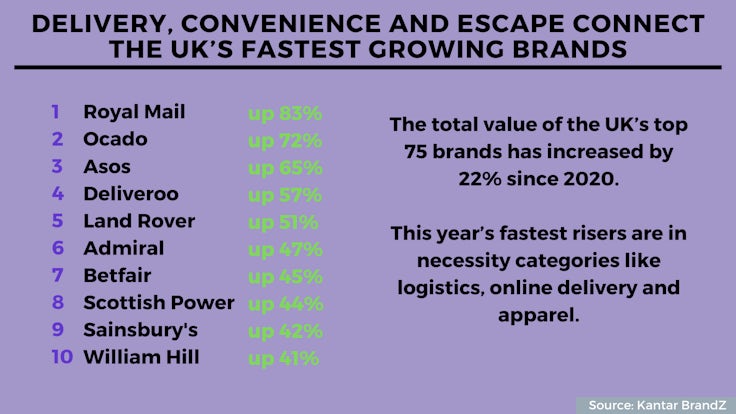
Delivery, convenience and escape connect the UK’s fastest growing brands
 The total value of the UK’s top 75 brands has increased by 22% since 2020. This is well ahead of the 6% global economic growth rate forecast in March by the International Monetary Fund, and far better than the FTSE 100, which is yet to recover to pre-pandemic levels (down 13% as of 7 September).
This year’s fastest risers are in necessity categories like logistics, online delivery and apparel, perhaps unsurprisingly given the upheaval of the past 18 months.
Royal Mail’s brand value has increased by 83% pushing it to 52 in the ranking and making it the UK’s fastest riser this year. Ocado is not far behind, rising 72% to 13, followed by Asos (up 65% to 27), Deliveroo (up 57% to 25), Land Rover (up 51% to 19) and Admiral (up 47% to 59).
There has also been a rise in brands that offer some form of entertainment or release for people. Betfair’s brand value increased by 45%, putting it at 53 in the ranking, while William Hill is now at 51 having increased its brand value by 41%.
The other brands to make it into the top 10 fastest risers list are Scottish Power (up 44% to 37) and Sainsbury’s (up 42% to 23).
Source: Kantar BrandZ
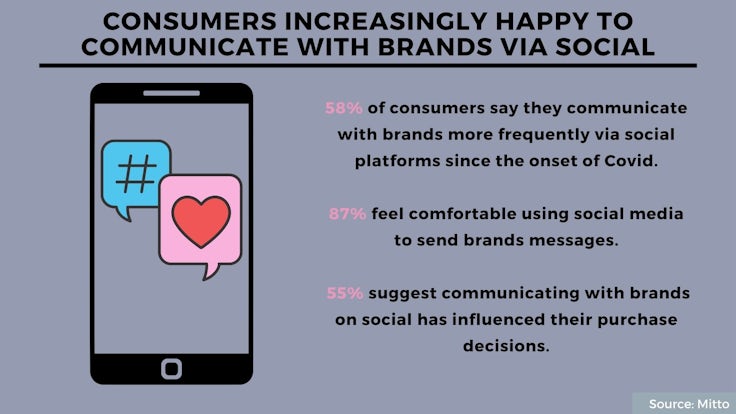
Consumers increasingly happy to communicate with brands via social
 More than two-thirds (70%) of consumers say their use of social media as a whole has increased since the onset of the pandemic, with 58% suggesting they now communicate with brands more frequently via social platforms.
The majority (87%) now feel comfortable using social media to send brands messages, with 55% suggesting that brands’ communication on social has influenced their purchase decisions.
More than three-quarters (77%) has used social media to contact a brand’s customer support, with 79% suggesting the experience was positive. Plus, more than half (58%) say they prefer communicating via social compared to email, call or text.
The consumers that prefer social over other communication methods say it is because it is more convenient (72%), faster (61%) and more personal (50%).
Source: Mitto
Three-quarters of Instagram influencers ‘hide’ advertising hashtags
 Three-quarters of Instagram influencers (76%) working with brands are “hiding” disclosure hashtags such as #ad, #spon and #gifted within a post rather than making them prominent.
Influencers were most likely to place the hashtag in the middle of the post (59%), while 24% put it at the end and 12% hid it in the comments section. Just 5% put it at the beginning of a post.
The Advertising Standards Authority says influencer marketing disclosures “must be prominent enough that consumers will easily notice” them and that “burying a label in list of hashtags…or placing it ‘under the fold’ where consumers would need to click ‘see more’…won’t be sufficient”.
The top 100 posts for each disclosure hashtag were analysed for the study to see whether they were visible in the original post or it needed to be expanded to be seen.
The hashtags used for analysis were #ad, which had the highest number of posts at 12.8 million, #advertisement (1.8 million), #sponsored (3.3 million), #gifted (1.8 million) and #affiliate (744,000).
The term #affiliate was most likely to be hidden, with 93% of uploads having it out of sight, while #gifted was found to be most prominent, with 60% of posts hiding the phrase.
The term #advertisement was most likely to be hidden in the comments section of the post, with 20% of relevant posts doing so, while #ad was most likely to be found at the beginning of the post, with 15% found here.
Source: Awin
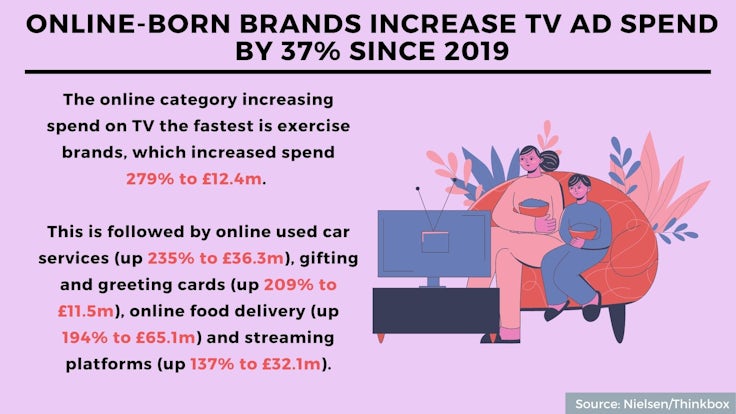
Online-born brands increase TV ad spend by 37% since 2019
 Linear TV advertising investment by businesses born online has increased by 37% since 2019, with some categories upping their spend by as much as 279%.
Analytics firm Nielsen and TV marketing body Thinkbox define online-born businesses as those which began online, with no prior bricks-and-mortar presence. According to new data provided by Nielsen, the online category increasing spend on TV the fastest is exercise brands, which collectively increased spend 279% to £12.4m. The category includes brands such as Peloton and Echelon.
Online used car services are another category driving considerable growth, with brands such as Cazoo, Carwow, Cinch and Webuyanycar having collectively upped their spend by 235% compared to the same period in 2019, reaching £36.3m in total.
The categories recording the next biggest spend increases are gifting and greeting cards, with brands such as Moonpig and Thortful boosting investment by 209% to £11.5m, online food delivery services such as Deliveroo, Just Eat and Gousto, which saw investment rise by 194% to £65.1m, and streaming platforms including Disney+, Netflix and Amazon Prime, which upped their collective spend by 137% to £32.1m.
Meanwhile, online marketplaces such as Amazon, Ebay, Etsy, Vinted and Gumtree increased TV spend by 103% to £63.1m.
Notable outliers include travel companies (Expedia, Airbnb, Hotels.com, Booking.com), which cut investment by 57%, as well as financial brands (Experian, ClearScore, Credit Karma) which dropped spend by 9%.
Altogether, online-born businesses invested £559.9m in TV advertising in the UK between January and July this year, a £151m boost. Collectively, these businesses now account for 20% of all linear TV ad spend, ahead of food (10.1%), finance (8.5%) and entertainment and leisure (7.2%).
Source: Nielsen/Thinkbox


