Investment companies | Update | 26 June 2023
True Colours
We are quickly approaching year three of Temple Bar’s rehabilitation under the new management of Redwheel, who took over the fund in November 2020. While sticking to its value-seeking roots, managers Ian Lance and Nick Purves favour a more balanced approach than the deep value model employed by the fund’s previous manager, which had been a drag on performance through the growth dominated decade that followed the GFC.
So far, the change has paid off handsomely, with the shares up 76% since the handover, 35 percentage points ahead of the benchmark UK index. Although it might be disingenuous to attribute the recent outperformance purely to the change in management, considering the dramatic swings we have seen in equity markets since the pandemic, the team certainly appears to have established a foundation for ongoing success.
UK equity income and capital growth
TMPL aims to provide growth in income and capital to achieve a long-term total return greater than its benchmark (the FTSE All-Share Index), through investment primarily in UK securities. The company’s policy is to invest in a broad spread of securities, with the majority of the portfolio typically selected from the constituents of the FTSE 350 Index.

Exploiting swings in investor sentiment
Targeted, bottom-up approach looking for stocks that are trading at a discount to their intrinsic value.
Although the managers still adhere to the general principles that define value investing, Nick and Ian follow a targeted, bottom-up approach to investment, looking for stocks that are trading at a discount to their intrinsic value with a five-year horizon. Using a quality overlay helps to weed out the potential for value traps, and the managers aim to generate alpha through selecting assets that may be sensitive to prevailing market conditions but are still able to generate sustainable growth over the medium-to-long term. It is a process that should find an easy home in today’s volatile market, with the last 12 to 18 months perfectly highlighting the wild swings that investor sentiment can have on prices.
Exploiting oil price volatility.
The energy sector is an obvious example, with the price of crude oil technically falling below zero during the peak of the pandemic panic, only to recover to trade at over $100 dollars a barrel in just over 12 months later. Whilst the managers point out that they make no attempt to time markets – instead making decisions based on long-term sector outlooks – they are cognisant of the economic environment when making decisions and are happy to take on opportunities to add exposure when scenarios such as these present themselves.
Starting valuation has proven to be the best predictor of investment returns over time.
There are plenty of other examples (although perhaps not as extreme) where investor sentiment clouds rational decision-making, creating opportunities to add value. Generally speaking, however, success with this type of value investing is best judged over the long term. Though the managers are the first to admit they are in the early innings of their journey with Temple Bar, the long-term potential for the fund appears considerable, especially given the relative valuations of portfolio holdings, which in many cases are still at or close to cycle lows. Importantly, as the managers highlight, starting valuation has proven to be the best predictor of investment returns over time.
Manager’s view
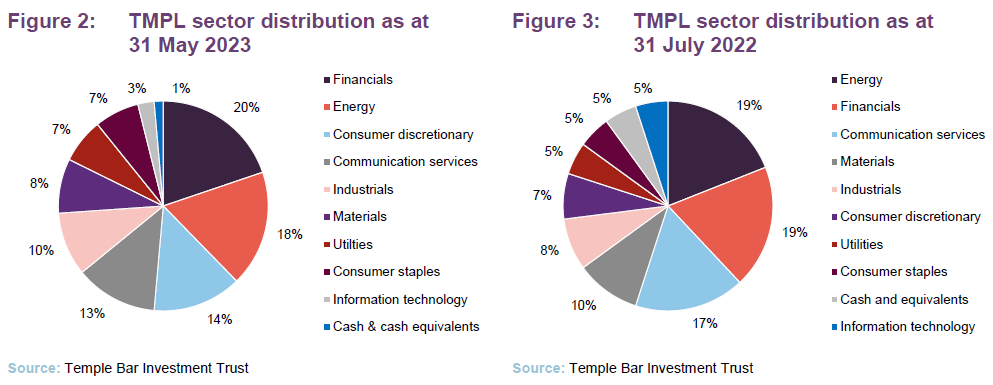
The bias towards long term value with sustainable upside is clear when we assess the portfolio composition. Almost 40% of the fund is invested in the energy and financials sectors which is a considerable overweight to benchmark indices, contributing to the fund’s aggregate price to book and price to earnings ratios, which are among the lowest in the UK equity income sector.
The opportunity in energy
The short-term opportunity in energy markets has been well documented following the Ukrainian invasion, and the sector was one of the few bright spots through 2022 in what was otherwise one of the worst periods in history across multiple asset classes. The outperformance of the sector was a key driver of returns for Temple Bar, contributing 7.6% to the company’s overall performance for the year, and whilst this was clearly beneficial for investors, the opportunity identified by the managers is much more than a short-term trade.
The global economy remains overwhelmingly reliant on burning fossil fuels for energy.
Despite the rapidly developing renewable transition, the reality is that the global economy remains overwhelmingly reliant on burning fossil fuels for energy, all the while demand for energy, which is closely linked to GDP, continues to grow exponentially, particularly in developing nations which in most cases have neither the capacity nor inclination to invest in renewables.
Demand for energy is expected to at least double in the next 25 to 30 years and despite the massive advances in renewable technology and the resulting reduction in costs, the collective efforts of solar, wind, hydro, and other sources of renewables have so far had only a modest impact on global power production with fossil fuels’ share of electrical power generation hovering between 60% and 70% for half a century (and remains higher today than it did in the 1940s).
Whilst renewable capacity and capability will continue to advance, the reality is that consensus expectations are for oil demand to grow, not fall over the next decade. At the same time, oil majors have shifted their focus to shareholder returns rather than investment in new production. With the depletion of existing producing resources, and damage done to the industry by the whipsaw in demand during the pandemic, there now exists a very real possibility of structural shortages in oil supply that cannot be effectively replaced by renewable assets, leading to structural shortages in total global energy supply, and hence higher long-term oil prices.
18% of TMPL’s portfolio is exposed to the energy sector.
Given these dynamics, the opportunity in energy markets is substantial, regardless of short-term headwinds from weak Chinese demand or wider fears around economic growth. With 18% of the fund exposed to the sector, consisting of investments in BP, Shell, and TotalEnergies along with energy service company Centrica, TMPL appears well positioned to benefit from this long-term opportunity.
Financials
The banking sector has long been a source of frustration for value investors, especially since the turn of the century where it has generated below-market returns despite offering consistently appealing valuations. The graph below illustrates the scale of the underperformance compared to the wider market.
With that as a backdrop, it might seem somewhat inauspicious that almost 20% of the Temple Bar portfolio is invested in the sector. However, as Ian pointed out in a recent note, a key job of an active fund manager is to find and own the very best investment opportunities that their relevant area of focus affords them. Dismissing a large number of companies, based on an assessment of the returns historically delivered by the sector in which they operate, would seem to overlook this imperative function. In addition, Ian adds that even if banks have performed poorly in broad terms, that is no reason to conclude that all banks have performed poorly and that the banking business model is flawed. There are, in almost all circumstances, standout performers to choose to be invested in.
The other point that we would make is that this underperformance occurred in a period where interest rates were falling and for some time were zero or even negative. Higher interest rates give banks the opportunity to grow their net interest margin. This can have a dramatic effect on their profitability, but needs to be weighed against the potential for higher defaults. Credit quality and balance sheet strength become paramount in this scenario.

What to do about value?
“valuation is in fact the best predictor of investment returns over time”.
As the historical performance of TMPL suggests, the decade following the GFC was a challenging time for value investors. The period was defined by anaemic growth, low inflation, and relentless central bank support which drove financial asset prices to extremes. With discount rates plummeting, investors were rewarded for piling into growth and momentum stocks which saw multiples reach levels not seen since the dot com bubble.
Many believed that the post-pandemic rally was the final hurrah for these ‘slowflation’ dynamics, as interest rates rose to combat the global inflation spike. Value outperformed, clawing back one of the most extreme divergences between its growth counterparts in history, boosting returns for companies like TMPL, which outperformed its benchmark by almost 50% in the two years following the pandemic. Fast-forward to today and growth is back in vogue, boosted by the hope of a soft landing and an artificial intelligence boom that has seen NVIDA become just the 7th company in history to reach the much vaunted trillion-dollar market cap.
At this stage, it seems far too early to judge if AI really is ‘the new fire’, as one excitable proponent exclaimed, or pets.com reincarnated. What we do know is a lot has to go right for companies like NVIDA to live up to their current valuations. NVIDA currently trades on a price to sales multiple of 40, which, to put it in context, would mean that it would need to pay back every single dollar in revenue it earns for the next 40 years to break even. That means not a single dollar goes to paying wages, R&D, or even tax – which, in our opinion, may be a challenge.
While the debate around the trajectory of interest rates and inflation is ongoing, we do know that over the long term, valuation is the best predictor of investment returns over time. Interestingly, growth and quality factors have historically been one of the worst.
What may also be surprising, particularly for those who suffer from the all-too-common affliction of recency bias, is that the success of growth companies through the 2010s is far and away the exception, and not the rule. In fact, lowly valued stocks have outperformed their growth counterparts in every decade bar two in the last 110 years, with the other previous period of outperformance occurring in the 1920s.
Considering the overwhelming dominance of US tech and the excitement factor provided by the likes of AI and cloud software, it is no surprise that investors have been reluctant to return to the old world of steady, reliable earnings generated by sectors such as industrials and banks. However, the reality is that these companies are trading on relative discounts that in many cases have never been more extreme. Whilst history does not repeat, it does rhyme, and in the case of the TMPL, the managers would much rather be on the right side of it, paying a discount for companies still generating huge amounts of free cash flow today, than to rely on the Terminator cooking our dinner.
Asset allocation
Since our last note (using data from 31 July 2022), the fund’s exposure to financials and energy has remained relatively stable. The big change over this period was the exposure to the communication services sector, which fell from 17% to 13%. The company’s cash position also fell from over 5% to 1%.
Gearing
Net gearing was 7.2%, in line with the position at the beginning of the year. Management has kept the exposure relative stable over the past 12 months, although it did reduce the level earlier in 2022 as market volatility increased.
Top 10 holdings

The top 10 holdings make up 57% of the fund. Since our last note, there has been two changes to this group with ITV and WPP moving up in the rankings in place of Anglo-American and IDS. No new positions have been added to the portfolio with the managers instead focusing on rebalancing existing positions.
BP, Shell and Total Energies
BP is the largest energy holding in the Temple Bar portfolio, accounting for 6.6% of total assets followed by Shell at 6.5% and further down the portfolio Total Energies at 4.7%. Returns have been poor so far this year, weighed down by concerns around global growth; however, short-term volatility in oil markets is common and should not distract from the structural opportunity that exists in the sector. This appears to be underappreciated by investors with earnings and cash flow multiples well below historical averages.

According to their own sensitivity analysis, the companies would be valued at roughly 10x earnings assuming an oil price of $60. Brent crude trades at about $70 at the time of writing and was as high as $120 this time last year, so it seems reasonable to take the view that there is a considerable margin of safety built into these prices, and the managers have taken this as an opportunity to add to these positions.
The valuations look even more attractive when compared to those of their North American peers. Over the past 30 years, the European oil majors have traded at a considerable discount, with the premium enjoyed by the US majors justified by higher historical returns on invested capital, which has often been seen to indicate superior portfolio competitiveness and resilience. However, with US majors outperforming by some 50% over the past three years, this valuation gap has widened to historical extremes at the same time as the European companies have been able to greatly improve relative profitability.
This valuation gap has long been a point of contention for investors and management alike, particularly given the rapidly improving operational performance.

One recent theory to explain the divergence in fortunes is a lack of clarity provided by the Europeans regarding the renewable energy transition. Whilst it is certainly possible that this has contributed, a greater focus on renewables in the long run should allow these companies to play both sides of the transition, generating profits from structural shortages in oil while also future-proofing long-term returns.
In any case, the recent operational performance has shown that the current business model remains highly profitable, driving valuations down to historic lows and providing a generational buying opportunity.
Centrica
Centrica stands to benefit from similar tailwinds to those driving record returns for the energy majors. The British multinational energy and services company supplies gas and electricity to residential, commercial, and industrial customers across the UK and Ireland. Managers Ian and Nick say it was once their “problem child” and the worst-performing stock in the portfolio, but over the last couple of years its fortunes have staged a dramatic reversal. Whilst the company is still well below its peak reached prior to the pandemic, shares are up more than 50% over the past year, and record profitability driven by the company’s energy and trading division has seen earnings multiples fall to half its historic average. This valuation reflects uncertainty about the outlook for energy prices, which are fresh of record highs, and the possibility of regulatory impacts; however, these concerns appear to be priced in.

The company should also benefit from a significant consolidation in energy markets over the last few years, further cementing its position as the leading player in the UK, and given the outlook for energy prices discussed on page 3 and the possibility of more short-term volatility in both demand and supply, the potential upside here is significant.
NatWest Group
NatWest is a major retail and commercial bank, primarily focused on the UK domestic market, and its performance has been particularly impressive since the beginning of 2022, outperforming the majority of its peers even as rising bond yields boosted net interest income for the banking sector as a whole.
Along with its improving profitability, the former Royal Bank of Scotland appears to finally be leaving behind it the more-than-a-decade-long controversy of its GFC bailout. Public ownership has fallen from a high of 84% to just 38.6% and the company now boasts one of the most stable balance sheets in the sector, which has helped shares reach a slight premium to its peer group (with a price to tangible book value of 0.8x). Instead of seeing this in a bad light on a valuation perspective, investors should view the recent performance as vindication of effective management after a generation of disappointment.
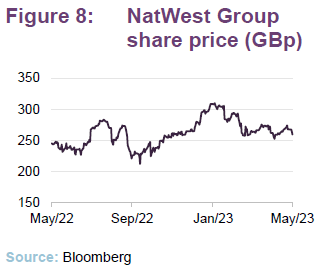
As with energy, the UK financial sector trades on a substantial discount to its US counterparts with Nat West and its London stock exchange listed peer group trading on a median price to tangible book value of around 0.7x, compared to the US banks at around 2x. The valuation gap has been a long-term trend, however, over the past three years it has started to close, reflecting the growing resilience of the UK banks which boast more diversified deposits and a much stronger regulatory framework.
Standard Chartered
The same fundamental upside exists for Standard Chartered, which trades on a discount to NatWest (not to mention the US banks) with a price to tangible book value of just 0.6x. With the vast majority of its revenues coming from Asian markets, the company’s shares have suffered as the region as a whole has struggled to recover from the pandemic and China’s zero-COVID polices, although this in turn has insulated it from the regional banking crisis that spread through the European and North American banking sector.
Like NatWest, the company has struggled for a long period, weighed down by various controversies, including billions of dollars of losses from risky emerging market loans which resulted in mass job cuts and a $5bn liquidity injection in 2015. This stood as a defining moment for the firm, and while financial performance was initially very slow to recover, a huge amount of work has gone into restructuring operations, and it appears that these are finally starting to bear fruit. The company’s most recent earnings showed the largest quarterly profit in almost a decade, and whilst one analyst noted that ‘’taking credit for better earnings as interest rates rise is like an ice cream man taking credit for the sun being out’’, the result is a clear validation of the company’s long-running efforts to improve financial performance and execution.
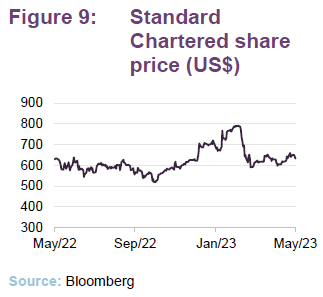
While the bank remains a ‘show me’ story, it appears to be one of the most undervalued banks in Europe. In addition to the valuation, its difficult to replicate footprint in growth markets of Asia and Africa, and an impressive revenue base makes it an attractive acquisition target. This has long been a topic of interest for investors and would certainly put a floor under the share price, and more likely provide a significant uplift.
Marks & Spencer
Marks and Spencer stands as a great example of the Temple Bar investment thesis playing out in real time. The retail outfit has long been a target for value investors; however, the company has struggled to deliver on its potential, with shares seemingly in terminal decline over the past 10 years.
Still, it appears to be making progress in what could be considered its most ambitious and costly overhaul to date, with 2022 marking the midpoint of an eight-year plan to modernise its stores and streamline sales. Motivated by a sustained slump in profits and the rapid digitalisation of retail, which was drastically accelerated by the pandemic, M&S has trimmed underperforming stores, product ranges, and a bloated headcount over the past four years. These measures have not come cheap, and since 2016 the group has built up over £800m of exceptional charges relating to UK store restructuring. The costs are ongoing, but already we are starting to see dividends from these investments (both literally and otherwise, with the company planning to reintroduce its dividend, which was paused at the start of the pandemic). Margins have already jumped well ahead of pre-pandemic averages, and we have begun to see market share gains, thanks to the improving quality and rationalisation of the company’s divisions.
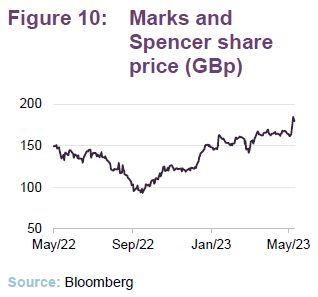
The market, it seems, may have finally taken notice. The stock is up 52% so far this year, comfortably outperforming its peer group and the wider market. The recent rally has pushed shares back towards long-term average cash flow and earnings multiples (sitting at around 11x and 5x respectively), and investors should see this as vindication of efforts by management to fix what was for a long time a company floundering dangerously close to value trap territory. Investors are certainly not out of the woods, with the stock still down almost 28% over the last five years; but for once, they have reason to be optimistic.
Pearson
Pearson continues the theme within the portfolio of companies reaping the benefits of a successful structural overhaul. The education, publishing and assessment service for schools and corporations has struggled in recent years, particularly as the market for educational material as shifted online. However, we are now in year three of new CEO Andy Bird’s tenure and the future is beginning to look much brighter. Shares now trade roughly 30% above their pre-COVID level, and whilst they remain well below the highs reached in 2015, the trajectory is trending upward; so much so that the company was second-best performer on the UK index through 2022.
Investor enthusiasm stems from the belief that the company’s existing education platform can provide the perfect launchpad for a new, high-growth, high-margin disruptor, with management comparing the opportunity to that of a Netflix or Spotify in the digital education space, with the additional benefit that the company already owns the vast majority of its content, the lack of which has severely limited the profitability of other streaming giants.
The company plans to transition to a subscription model that has proved to be remarkably lucrative for some of the world’s largest companies such as Microsoft and Adobe, and we have seen an almost universal transition to this structure by the software industry over the last few years. Additional upside for Pearson exists as it shifts its focus from low-margin physical copy to a digital offering.
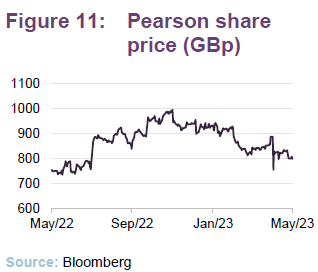
Unlike the majority of the other holdings in the portfolio, which are undervalued due to investor uncertainty or prevailing market conditions, Pearson’s current operations appear reasonably priced by the market. However, the managers feel that this does not reflect the potential upside of the digital educational offering, which was given further vindication following two separate private equity approaches over the past year.
IDS/Royal Mail
British postal service Royal Mail Group has been a long-term favourite of TMPL’s managers, although shares in the company have been steadily trending downward for more than a decade. This trend has been interspersed with several monumental rallies, highlighting the difficulties investors have had valuing the company as a whole. Most recently, shares rallied almost 400% from the trough of the pandemic to the middle of 2021 as the company benefitted from consumption shifts from services to goods. Investors piled in as free cashflow for the company soared, allowing management to drive capex to improve distribution services and operational efficiencies.
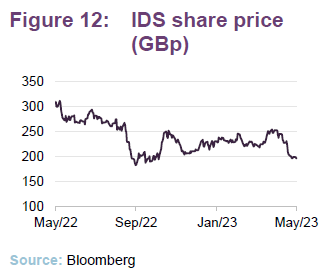
Fast-forward 12 months, and shares have plunged as pandemic induced tailwinds have slowed while the company has faced a raft of issues including strikes (which cost the company over £200m during FY2022), dramatic inflation-driven cost increases, and a crippling cyber-attack. Collectively, these issues have dragged Royal Mail into a profitability hole from which they are not expected to escape until 2025.
While it may appear difficult to paint a rosy picture given these challenges, prior to the pandemic, Royal Mail was generating consistent top line growth, EBITDA margins in the mid-to-high single digits, and a generous dividend. This all came at a multiple well below market, which has fallen further as shares have collapsed. So, despite the considerable challenges the company is facing in the short term, the underlying fundamentals remain attractive.
In addition, the kicker for TMPL’s managers is the quality of the company’s higher-margin international business, GLS, which has remained insulated from the turmoil currently surrounding the UK-focused Royal Mail. The company continues to generate strong margins and its standalone value is considered greater than the stock market valuation of the entire group. As Ian and Nick have noted, the stock market has therefore placed a substantial negative valuation on Royal Mail, even though it is the leader in the UK parcels market and has significant surplus property that can be sold off over time.
Given the struggles faced by Royal Mail, management is open to separate the two businesses to avoid valuation leakage, and any formal separation should throw a spotlight onto the very significant under-valuation of the group’s shares.
ITV
The investment in ITV, the UK-focused broadcaster and producer, appears to be more of a traditional value-driven decision with shares of the company trading at an almost 50% discount to historical averages. The company is divided across its broadcasting and studios businesses, and while revenue growth from advertising has remained relatively robust and the group’s normalised earnings are expected to produce a cashflow yield of around 15%, the upside appears to be driven by the studio business, which is one of the largest producers in Europe and has long been considered an acquisition target.
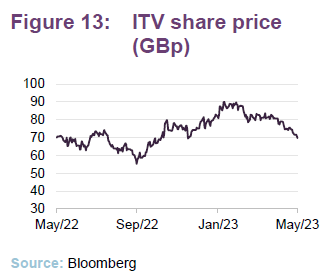
Management has generally been reluctant to consider spinning off the production arm, which some commentators believe is worth more than the parent company itself. However, given the trajectory of the company’s shares, which have fallen 75% since 2015, it is clear that a shakeup is needed. A transaction of this scale could help reset expectations and provide a considerable windfall for investors.
Performance
As noted on page 1, Temple Bar has comfortably outperformed the benchmark Index since managers Ian and Nick took over the portfolio in November 2020, with a total return of 77% compared to 42% for the index. Whilst the fund benefitted from the global rotation away from growth into value, stock selection has clearly boosted returns, even over the relatively short period of time that the managers have been in charge. Over the past year, substantial positions in Centrica, Marks and Spencer, NatWest. and BP have led the way in terms of relative performance.
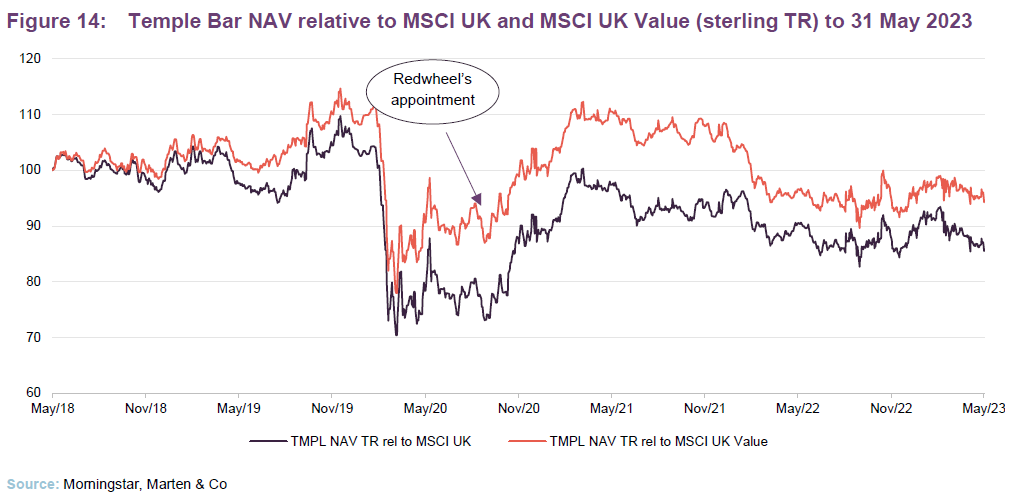
Impressively, the fund has also outperformed the benchmark year to date despite the heavy allocation to sectors which have struggled as flows revert towards growthier sectors of the market.
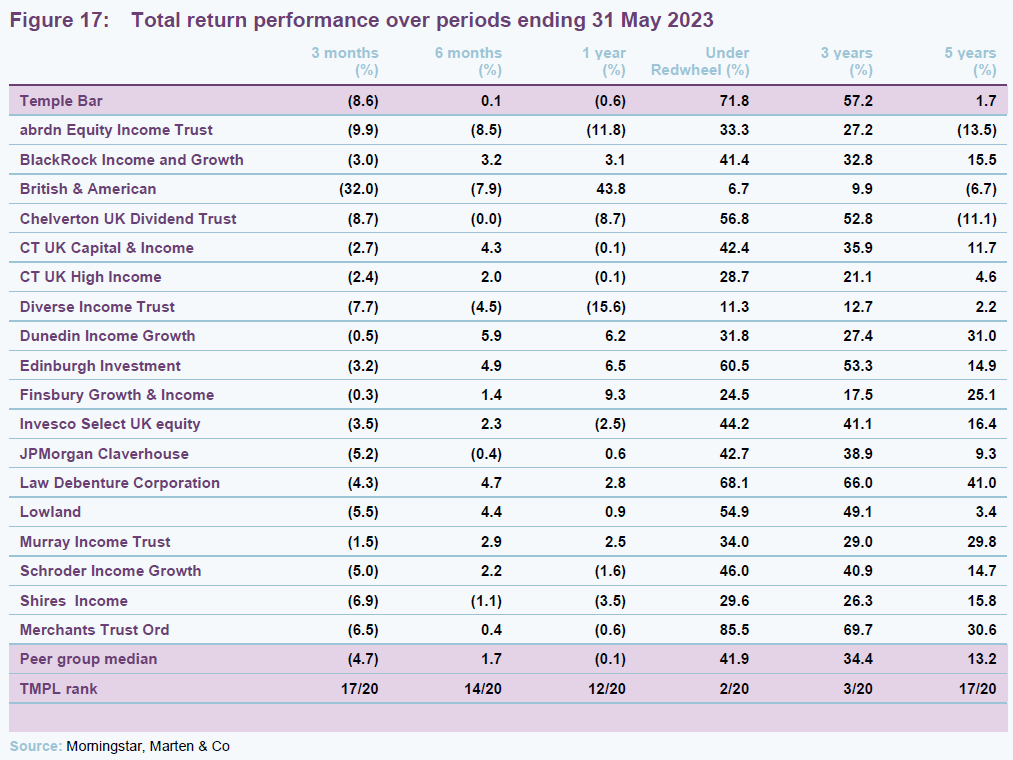
Longer term, TMPL has been one of the worst-performing stocks in its peer group, (See Figure 17 on page 16), with the previous managers targeting a deep-value strategy in decade following the GFC, which was dominated by growth and momentum.

Peer group
TMPL is one of 20 funds in the AIC’s UK equity income sector. With a market cap of £685m, it is one of the larger funds within the peer group and this is a factor in its extremely competitive ongoing charges ratio. At 0.54%, it is the fifth-lowest in the sector and is below the sector median of 0.67%.
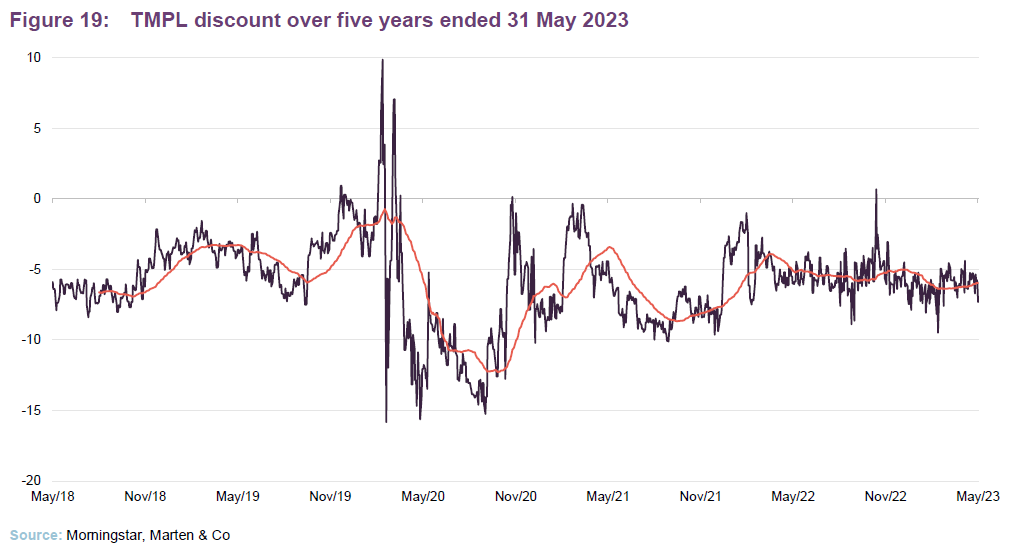
Discounts have continued to widen since our last note and there has been marked volatility in both markets and investment trust discounts, arguably reflecting both rising interest rates and an increasing prospect of recession. TMPL has not been immune to this (See Figure 19 on page 17).
Interestingly, despite its strong value bias, TMPL’s discount continues to be towards the wider end of its peer group. The same is true for the dividend yield, although reflecting softening share prices across the sector, the broad trend has been one of rising yields since we last wrote.
Dividend
TMPL pays dividends quarterly. For a given financial year ending 31 December, the first dividend is paid in June with the second, third and fourth dividends paid in September, December and March respectively. As touched on in our last note, the company’s income account has been more robust than expected. As a result, the company paid out a total dividend of 9.35p per share for the year ended 31 December 2022, an increase of 18.4% over the 2021 level. The 2022 dividend was fully covered by earnings during the year.
The board has also noted that it is confident the dividend will increase from this level over time, and declared on 9 May its first interim dividend for the year ending 31 December 2023 of 2.3p per share. This represents a 12% increase from the first interim dividend paid in 2022. As at June 22, TMPL had a TTM yield of 4.16%.
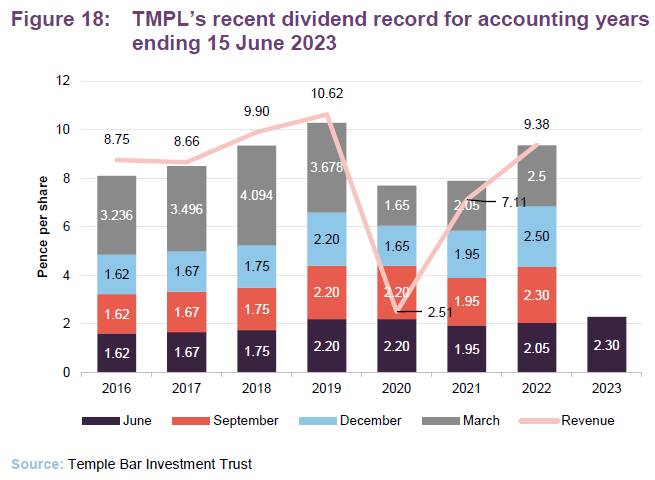 figure18
During 2020 the trust cut its dividend to rest the level of payouts. During this period, revenue per share fell well short of the dividend paid, and the balance was met from revenue reserves. At 31 December 2021, the trust’s revenue reserve stood at £11,708,000 and by 30 June 2022, this had fallen to £11,442,000. This has since recovered and as of 31 December 2022, the company had distributable revenue reserves of £13,381,000, which is equivalent to 4p per share. The distributable, realised capital reserve stood at £552,339,000.
Premium/(discount)
Over the 12 months ended 31 May 2023, TMPL’s shares moved to trade between a discount of 9.5% and a premium of 0.7%, averaging a discount of 5.7%. At 22 June 2023, TMPL was trading on a discount of 5.6%.
TMPL’s discount has been volatile, but narrowed after Redwheel’s appointment and narrowed again as evidence built that the new strategy was feeding through into improved relative returns.
At each AGM, the board asks shareholders for permission to buy back and issue shares within the usual parameters. Repurchased shares are held in treasury.
The board and investment manager closely monitor both significant trading activity and movements in the share price. As of 1 June 2023, the issued share capital of the company was 334,363,825 ordinary shares, of which 29,836,862 are held in treasury. During the 2022 financial year, the company purchased 10,896,039 shares for a total consideration of £25.9m, or around 3% of the total issued share capital. Over the first six months of 2023, the company had purchased a further 13,295,423 ordinary shares.
Fund profile
You can access the trust’s website at: templebarinvestments.co.uk.
TMPL aims to provide growth in income and capital to achieve a long-term total return greater than its benchmark (the FTSE All-Share Index), through investment primarily in UK securities. The company’s policy is to invest in a broad spread of securities with typically the majority of the portfolio selected from the constituents of the FTSE 350 Index.
Co-managers Nick Purves and Ian Lance aim to rotate the portfolio into those companies which they believe are available at a significant discount to intrinsic value. This involves buying the shares of attractively valued, out-of-favour companies and holding them for the long term until their share prices more appropriately reflect their true value, or until even more attractive ideas present themselves.
Redwheel became manager of TMPL on 1 November 2020.
For 18 years, TMPL was managed by Alastair Mundy, who was head of the Value Team at Ninety One UK. He stepped down as manager in April 2020, and on 23 September 2020 the board announced that it had selected RWC Asset Management (which rebranded as Redwheel in 2022) as TMPL’s new investment manager. Redwheel took on responsibility for the portfolio with effect from 1 November 2020, with Nick and Ian named as co-managers. They have over 50 years’ experience between them and have worked together for more than 13 years. The two co-manage over £3bn of assets across a number of income funds. As of July 1 2023 TMPL’s AIFM will transfer from Link Fund Solutions to Frostrow Capital.
Previous publications
Readers interested in further information about TMPL – such as investment process, fees, capital structure, life and the board – may wish to read our annual overview Time to shine, published on 31 August 2022, as well as our previous notes (details are provided in Figure 22 below). You can read the notes by clicking on them in Figure 22 or by visiting our website.
Figure 20: QuotedData’s previously published notes on TMPL
Source: Marten & Co
Legal
This marketing communication has been prepared for Temple Bar Investment Trust Plc by Marten & Co (which is authorised and regulated by the Financial Conduct Authority) and is non-independent research as defined under Article 36 of the Commission Delegated Regulation (EU) 2017/565 of 25 April 2016 supplementing the Markets in Financial Instruments Directive (MIFID). It is intended for use by investment professionals as defined in article 19 (5) of the Financial Services Act 2000 (Financial Promotion) Order 2005. Marten & Co is not authorised to give advice to retail clients and, if you are not a professional investor, or in any other way are prohibited or restricted from receiving this information, you should disregard it. The note does not have regard to the specific investment objectives, financial situation and needs of any specific person who may receive it.
The note has not been prepared in accordance with legal requirements designed to promote the independence of investment research and as such is considered to be a marketing communication. The analysts who prepared this note are not constrained from dealing ahead of it, but in practice, and in accordance with our internal code of good conduct, will refrain from doing so for the period from which they first obtained the information necessary to prepare the note until one month after the note’s publication. Nevertheless, they may have an interest in any of the securities mentioned within this not.
This note has been compiled from publicly available information. This note is not directed at any person in any jurisdiction where (by reason of that person’s nationality, residence or otherwise) the publication or availability of this note is prohibited.
Accuracy of Content: Whilst Marten & Co uses reasonable efforts to obtain information from sources which we believe to be reliable and to ensure that the information in this note is up to date and accurate, we make no representation or warranty that the information contained in this note is accurate, reliable or complete. The information contained in this note is provided by Marten & Co for personal use and information purposes generally. You are solely liable for any use you may make of this information. The information is inherently subject to change without notice and may become outdated. You, therefore, should verify any information obtained from this note before you use it.
No Advice: Nothing contained in this note constitutes or should be construed to constitute investment, legal, tax or other advice.
No Representation or Warranty: No representation, warranty or guarantee of any kind, express or implied is given by Marten & Co in respect of any information contained on this note.
Exclusion of Liability: To the fullest extent allowed by law, Marten & Co shall not be liable for any direct or indirect losses, damages, costs or expenses incurred or suffered by you arising out or in connection with the access to, use of or reliance on any information contained on this note. In no circumstance shall Marten & Co and its employees have any liability for consequential or special damages.
Governing Law and Jurisdiction: These terms and conditions and all matters connected with them, are governed by the laws of England and Wales and shall be subject to the exclusive jurisdiction of the English courts. If you access this note from outside the UK, you are responsible for ensuring compliance with any local laws relating to access.
No information contained in this note shall form the basis of, or be relied upon in connection with, any offer or commitment whatsoever in any jurisdiction.
Investment Performance Information: Please remember that past performance is not necessarily a guide to the future and that the value of shares and the income from them can go down as well as up. Exchange rates may also cause the value of underlying overseas investments to go down as well as up. Marten & Co may write on companies that use gearing in a number of forms that can increase volatility and, in some cases, to a complete loss of an investment.
230626 TMPL Update MC


